
Originally published here on Peter’s blog, with the first part reproduced here:
(… continued from He came forth and saw a great multitude, part 1, posted on 20 Mar 2017).
In his most recent letter to the Transport Secretary, the Chairman of the Commons Treasury Committee, the Rt Hon Andrew Tyrie MP, leads on the November 2016 recalculation of the BCR for the full network published by the Department for Transport (DfT). He zooms in on a particular figure, in the form of a bar chart, that has been used to illustrate this case, and that I have reproduced below.
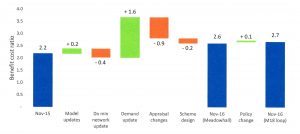
Changes made to the full Y BCR (Source: Department for Transport, see footnote 1)
In this figure the extreme left-hand blue bar represents the BCR that was calculated in November 2015 (see footnote 2), and the other two blue bars represent the BCR values as recalculated at November 2016, both for the original Sheffield Meadowhall station option and for the new “M18 alignment”. The green and, sort of, orange bars in between the two left-hand blue bars illustrate the contributions that have been made by various identified adjustments to the uplift in BCR between the November 2015 and November 2016 recalculations.
In his letter, Mr Tyrie comments, in particular, on the largest of these contributions; an increase in BCR of 1.6 that comes from “more recent outturn demand data from 2011 to 2014”. He observes:
“If the demand update were to be removed, the benefit-cost ratio falls dramatically, from 2.7 for the full network, to 1.1. In other words, without this latest data, the business case suggests that HS2 is scarcely worth the candle.”
Indicating that he entertains a degree of scepticism that previously unsuspected hordes have only now been identified as potential seat occupiers on HS2, Mr Tyrie opines that “the credibility of this sharp rise in forecast demand is crucial to the whole HS2 project”. He also makes the reasonable comment that, on the basis that the DfT is now claiming that the actual passenger growth between 2011 and 2014 was much higher than forecast by its modelling, it is a “serious concern” that the model got things so wrong. If the model proved to be so inaccurate over so short a time span, what possible faith can we have in the HS2 demand predictions that stretch twenty years or so into the future?
In fairness, in its document the DfT cites two other factors that have contributed to the BCR hike from its “demand update”: updating the base year in the demand model to 2014/15; and, changing from a bespoke HS2 demand cap (at a certain level of demand) to a standard rail approach 20 years in the future (see footnote 3). The document does not divulge how much these two additional factors have contributed to the BCR hike, but I suspect that the removal of the demand cap, in particular, might be significant (see footnote 4).
For those of us wishing to delve deeper into the reasons behind the “demand update” BCR hike, the DfT document does promise “a full report on the changes [since 2015]” in another document that is referenced in a footnote (see footnote 5). Unfortunately, I have been unable to locate this cited document, although I have found one in a similar vein, but considering changes since 2013, and published a couple of months later than the date given in the citation. Confusingly, this alternative source indicates that “demand growth is forecast to be slightly slower than in our previous forecasts” (see footnote 6). The document also indicates that the demand cap is still being applied (see footnote 7) and that the changes in predicted demand have resulted in a slight BCR reduction, rather than the steep increase referred to by Mr Tyrie (see footnote 8).
So what is going on here? Clearly, the Transport Secretary not only owes Mr Tyrie a response to his observations, but owes those of us who concern themselves with such matters a clarification of this apparently confused situation.
Mr Tyrie’s letter has also raised, admittedly somewhat obliquely, another bone of contention concerning the business case evaluation. When Mr Tyrie refers, in his opening paragraphs, to the value for money (VfM) rating of the project, he employs BCRs that exclude wider economic impacts (WEI). The DfT, on the other hand, whilst admittedly usually quoting BCR with and without WEIs, tends to favour the BCR including WEIs when evaluating the VfM rating. One authority, at least, supports Mr Tyrie over the DfT, recommending that WEIs are “only used as a sensitivity test, rather than a key element of the evaluation” (see footnote 9).
One final observation that I wish to make concerns the assertion made by Mr Grayling, that I reported in part 1, that the VfM rating is “robust to a wide range of scenarios”. The two categories of VfM “low” and “medium” are both 0.5 BCR units in range. This means that, in theory, a BCR hike of 1.6, as identified in the above bar chart, could take the rating from “poor” to “high” (see footnote 10), indicating perhaps that VfM is not as robust a measure as Mr Grayling would like to think.
Footnotes:
- The bar chart is Figure 1.2 in the publication High Speed Two Phase 2b, Strategic Outline Business Case: Economic Case, Department for Transport, November 2016.
- See paragraph 3.15 in the publication HS2 West Midlands to Crewe, Strategic Outline Business Case: Economic Case, Department for Transport, November 2015.
- See the third bullet point of paragraph 1.25 in High Speed Two Phase 2b, Strategic Outline Business Case: Economic Case.
- For a discussion of the impact that the demand cap can have upon the demand prediction see my blog Let’s be courageous, part 12 (posted 11 Oct 2016).
- See paragraph 1.24 and footnote 5 on page 10 of High Speed Two Phase 2b, Strategic Outline Business Case: Economic Case. The cited document, which I have been unable to trace is Summary of Key Changes to the Economic Case Since 2015, HS2 Ltd, November 2016.
- See paragraph 5.2.2 in the publication HS2 Phase Two Summary of key changes to the Economic Case since October 2013, HS2 Ltd, January 2016.
- See paragraph 5.2.1 in HS2 Phase Two Summary of key changes to the Economic Case since October 2013.
- See paragraph 5.3.4 and Table 8 in HS2 Phase Two Summary of key changes to the Economic Case since October 2013.
- See page 19 of the paper Douglas N, and O’Keeffe B. Wider Economic Benefits – When and if they should be used in evaluation of transport projects, Australasian Transport Research Forum 2016 Proceedings, November 2016.
- The BCR ranges that set the VfM category boundaries may be found in paragraph 2.4 of the publication Value for Money Assessment: Advice Note for Local Transport Decision Makers, Department for Transport, December 2013.
Graylings reply which didn’t appear on TSC website until 24 April
http://www.parliament.uk/documents/commons-committees/treasury/Correspondence/Letter-from-SoS-Transport-HS2-23-01-17.pdf