
Originally published on Peter’s website.
When I was a lad I was a big fan of the puzzle page in the children’s comics of the day. I remember one particular type of puzzle that was a jumble of numbered dots: only when you joined the dots in sequence by straight-line segments did a picture emerge. Whilst this may not have posed much of an intellectual challenge, it was very satisfying to see a picture gradually emerging from the chaos of dots and numbers. I don’t know whether these puzzles have survived the technological revolution that has meant that the kids of today have many more sophisticated distractions, but I hope so. Certainly, to judge by a drawing that has recently come into my possession, HS2 Ltd might have taken some inspiration from them.
The drawing to which I refer came to me within the Promoter’s evidence pack provided for the Lords Select Committee hearing of the petition by Cubbington Parish Council, for which I was acting as Roll B Agent, and it depicts the operational noise contours that will affect the Parish. It bears the Promoter’s reference P1191 12. Since the Cubbington PC petition did not raise noise as an issue, I assume that a similar drawing will be standard issue to all petitioners irrespective of whether they have petitioned against noise or not. The drawing reference number is the same as the equivalent drawing that was included in Volume 5 of the Environmental Statement (SV-02-046). I have reproduced a section of this drawing below.
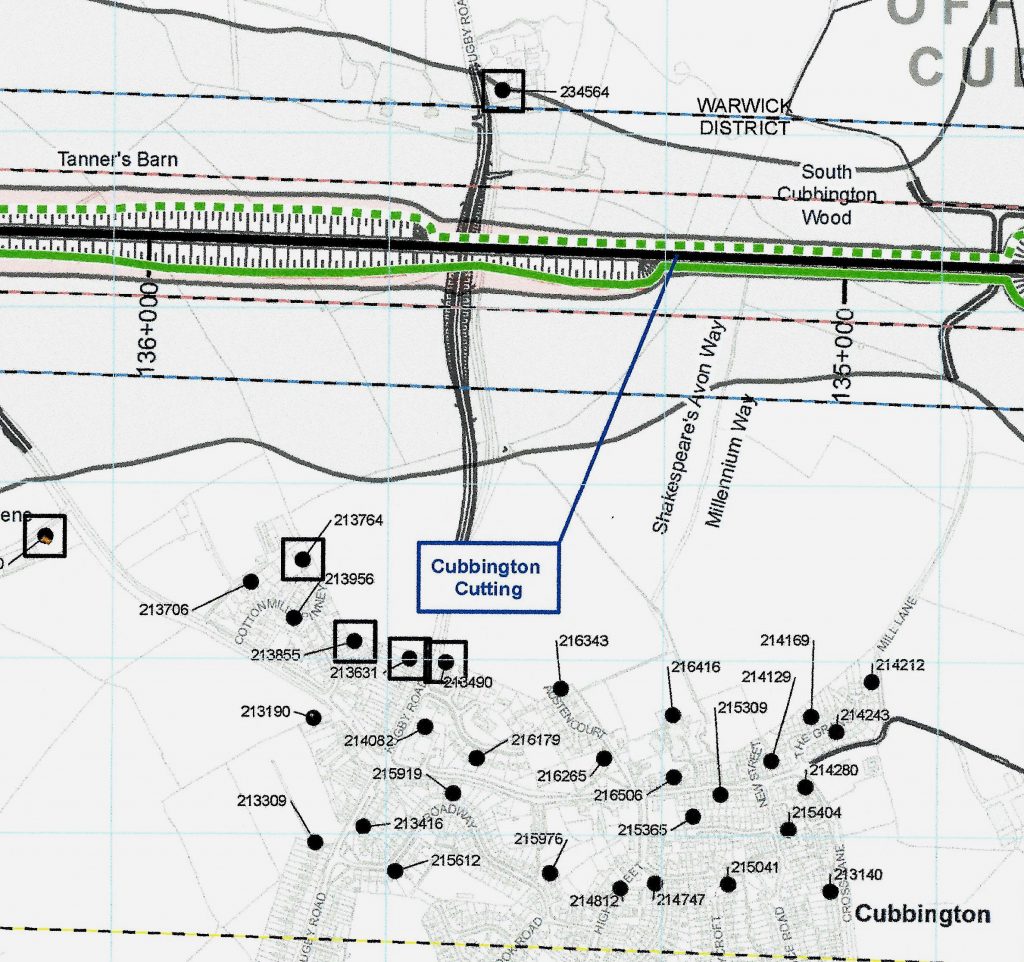
The new version of SV-02-046 appears identical to the original version in the Environmental Statement (ES) with one small change; some of the dots indicating locations where operational noise assessments have been made now have squares drawn around them. The drawing legend informs that these squares indicate that these particular assessment locations have LAMax in excess of, or equal to, 60dB, measured at the façade of a building. A further note advises that the level that has been calculated is for HS2 train noise only, and the calculated free-field levels tabulated in the ES have been converted to façade levels by adding a 2.5dB correction – so a level of 57.5dB LAMaxin the ES tabulation comes out at 60dB façade.
Those of you who have been paying attention over the past months will appreciate that what the drawing is showing is the extent of operational noise from HS2 trains that is predicted to equal or exceed the lowest observed adverse effect level (LOAEL) determined in three ways. The full line enclosing the grey shaded area is a contour for 40dB LpAeq,night, which has been specified by HS2 Ltd as LOAEL night using the equivalent continuous sound level methodology for calculating noise. A reasonable simplifying assumption has been made that this contour also represents 50dB LpAeq,day. The squares are an attempt to indicate the limits of the LOAEL contour when considering the noise from a single train pass-by. This lowest adverse effect level has been determined by considering the sleep disturbance effects of each train pass-by, and the health effects arising therefrom, and so is applicable to the night hours only; as I explained above, this LOAEL has been set by HS2 Ltd at 60dB façade (57.5dB free-field).
What we can’t tell precisely from the HS2 Ltd version of a join up the dots puzzle is exactly where the 60dB LAMax contour should be drawn. All that we can say is that it will lie somewhere between each dot with a square around it and the nearest dot without a square that is further away from the trackline.
So these squares represent HS2 Ltd’s response to its acceptance that the noise maps were deficient in only showing the limits for LOAEL calculated in two out of the three possible ways. As I was told at the Kenilworth information event in late April this year, and reported in my blog What a turn-up (and turn-out)! (posted 16 May 2016), we have not been given the LAMax LOAEL in contour form, and so the depiction is inconsistent with the way that the two equivalent continuous sound level LOAELs have been shown.
What is abundantly clear from the location of the squares is that the area over which operational peak noise from a single train pass-by is predicted to exceed LOAEL is much larger than when LOAEL is defined in terms of the equivalent continuous sound level.
Take for example the bottom-most and most right square on the map reproduced above, which happens to be within fifty metres of where I live. This dot/square is just about twice as far from the track centreline as the 40dB LOAEL contour. This hardly comes as a surprise, since it was pointed out in evidence given to the Commons Select Committee by the Promoter’s noise expert, Rupert Thornely-Taylor, a number of times, that the LAMax LOAEL contour defines a larger area, as I reported in my blog I’m sorry, what did you say? (posted 14 Nov 2015).
It is important to bear in mind that this isn’t a trivial matter. LOAEL is an important threshold, because as well as demarcating the area where HS2 noise may lead to adverse effects on health and wellbeing being observed it also designates the point at which the developer is required to “mitigate and minimise adverse impacts on health and quality of life” by the Noise Policy Statement for England.
What is clear is that the noise contour maps that the Promoter produced as evidence of noise effects throughout the Commons Select Committee process understated the true effects of HS2 operations, and it is only now, more than thirty months after the ES was first published and almost two years after the first petitioners were heard, that maps that show the true picture are being presented in evidence.
You might think that this clean breast has taken far too long, and has come far too late to influence the Bill process – you might very well be right.
As no trains have been built yet how does anyone know how noisy they will be? When I went to a presentation at Stafford Showground I was played an alleged similar train noise which was no more than a whisper. This was a blatant deception on their part and I believe that deception by HS2Ltdis still the real game here.